Understanding Spread Betting in the NFL and the Kelly Criterion
Overview
I’ve always been a football fan. I grew up rooting for the Denver Broncos, which meant that I had a very very happy childhood. As I learned more about machine learning and data science, I wanted to see how well it would apply to NFL predictions. There are two types of NFL predictions we will look at:
- Predicting Game Winners (A Classification Problem)
- Predicting the Spread (A Regression Problem)
First, I will to discuss how well Vegas and other experts do at prediction, and find a ballpark figure for what sort of accuracy would constitute profitability.
1. Predicting Game Winners
First I want to look at just predicting game winners. We’ll get to spread prediction afterwards. Each team plays 16 games a year, and there are 256 total games played in an NFL season.
Below are the results for several notable predictions for the 2015 NFL regular season. Note that the y-axis has limits of [60, 70]. This is to clarify the differences between the models.

FiveThirtyEight creates their predictions using Elo ratings. You can find more info about it here. Bing Predicts has an interesting blog post here about their general methodology. ESPN’s picks can be found here. Their best expert was Chris Mortensen, who was 63.7% accurate.
How good is Vegas?
The figure below shows how well Las Vegas has done at predicting game winners over the last nine years. As you can see, last year was their worst year shown.

Note: If Vegas predicts an even line, that counts as no pick, and I don’t include that game in my final yearly tally.
How good can we be?
The website NFL Pick Watch provides predictions for over 100 hundred “expert” NFL analysts from various tv and newspaper sources. I scraped this data and plotted it below. You can see that the distribution is approximately normal with a mean of 60.15% and standard deviation of 3.02%.

As the figure shows, the average ESPN expert was right in line with the average expert prediction. Vegas was around one standard deviation above average, and FiveThirtyEight had the second highest score for 2015.
2. Predicting the Spread
Explanation of the Spread and the Vegas Line
Let’s start with an example. In Super Bowl 50, the Vegas line for the game was Carolina Panthers -5.0. This means that the Panthers were expected to beat the Denver Broncos by 5 points. Let’s say you bet on the Carolina Panthers. There are four possible scenarios:
- You win if Carolina beats Denver by more than 5 points.
- You push (tie) if Carolina wins by exactly 5 points.
- You lose if Carolina wins by less than 5 points.
- You lose if Denver wins by any amount.
The final score of the game was: Carolina Panthers: 10, Denver Broncos: 24. Denver won! The actual spread, or true line, was Denver Broncos -14.0, and so Las Vegas’ prediction was 19 points off. Thus, if you had bet on Carolina you would have lost.
Another way to think of the Vegas Line is as a handicap. If you penalize the favorited team by the spread, then the teams are, according to Vegas, evenly matched, and the game would theoretically end in a tie.
How spread betting works
Spread betting is more difficult than game prediction because now you are competing directly against Las Vegas. The odds for this type of bet are typically 10 to 11, or -110. This means if you wager $110 and win, you win $100 (plus the $110 you put in) for a total payout of $210. We can figure out the break even line, which tells you the probability at which you would expected to make a net profit of exactly $0.
Solving this equation gives you p = 0.524. In other words, if you have a betting strategy that is greater than 52.4%, then over time, you will beat Vegas! Below is a plot that shows the percent return at the end of a season based on two types of betting strategies, which will be explained below. Also included is the results of FiveThirtyEight’s 2015 spread predictions. Betting with their spreads would have netted you a 4.7% return on your bets if you used a straight betting strategy.
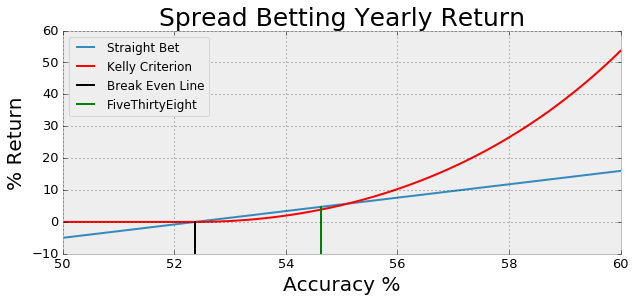
Straight betting
Here I assume you bet a fixed amount per game, in this case $10. The net return is based upon wagering $10 per game for 256 games for a total risk of $2560. These numbers are only a rough guideline because you can’t win a fractional amount of games.
Kelly Criterion
The Kelly Criterion is an optimal betting strategy in probability theory proposed by J. L. Kelly, Jr in 1956, which tells you what fraction of your bankroll to wager as a function of the odds of the game and your probability of winning. The formula is given by
where b is the odds (for spread betting b = 10/11) and p is your probability of winning. I assumed that the bankroll began at $2560, the same amount of money you risk in the straight betting formulation. Once f* is determined, I place my bets evenly over the number of games for that week. For example, if f = 0.2, the bankroll is $2560, and 16 games are played that week, I would bet $512 that week, or $20 per game. For values less than the break even point, 52.38%, the Kelly criterion smartly tells you to not bet (f* < 0). At the end of each week, you add the profits from that week to your bankroll. Thus, if you have a winning strategy, you will increase your bets each week.
Conclusions
Now that we know what sort of values constitute success with regards to both game prediction and spread betting, we can build some simple machine learning models and see how well they perform. But first, we have to acquire the data!